
ALTOONA, Pa. -- Penn State is ranked 114th in the nation in rushing offense, out of a total of 130 teams. The Nittany Lions are averaging a meager 108.1 yards rushing per game.
Those numbers beg the question of whether this is the worst Penn State rushing attack ever. And it's incredible that we even have to ask that question, given that there were extremely high hopes for the ground game entering the season because of so much running back depth.
We'll answer that question shortly, but first ...
The season isn't over, and there's still time for Penn State to improve the rushing numbers. There's also some good news on the immediate horizon with this week's game at Maryland, which has struggled stopping the run. The Terps are allowing 161.0 yards per game on the ground, ranking 79th in the nation.
And in two weeks, Rutgers visits Beaver Stadium. The Scarlet Knights are giving up 143.8 yards per game, ranking 59th.
One would think the Lions will run well against those two defenses.
However, there also are two very difficult run defenses awaiting. Next week's opponent, Michigan, is 15th in the nation (117.7 ypg), and in the regular-season finale, Michigan State leads the country in rushing defense (88.5 ypg).
I went back through the entire history of NCAA rushing statistics to find out if this is the worst Penn State rushing attack ever. The answer, and it was really easy to find, is no.
But this is the second worst.
It will be very difficult for any Penn State ground attack to be worse than what we saw in 2014, James Franklin's first year as head coach. Freshman Christian Hackenberg was the quarterback, the offensive line was a mess and thin, and Akeel Lynch (678 yards) and Bill Belton (526) were the leading rushers.
Penn State averaged a woeful 101.9 yards rushing per game in 2014, finishing 117th in the nation, out of 125 teams.
As bad as things have been this season, you'd have to figure big games against Maryland and Rutgers would bump the Lions' overall rushing numbers up significantly to where they won't finish close to those miserable 2014 stats.
But there's still a chance this year's team will finish with the second-worst rushing totals on record, dating back to 1950. To avoid that distinction, the Lions would have to top 119.7 yards per game, which is where the 2001 team finished.
We'll hear from Penn State running backs coach Ja'Juan Seider today, and this story will be updated with his comments later on.
For now, here's a look at Penn State's rushing numbers throughout history. The NCAA record book only lists national rankings going back to 1989. For years prior to that we used Sports Reference for the Lions' annual rushing totals, which go back as far as 1950.
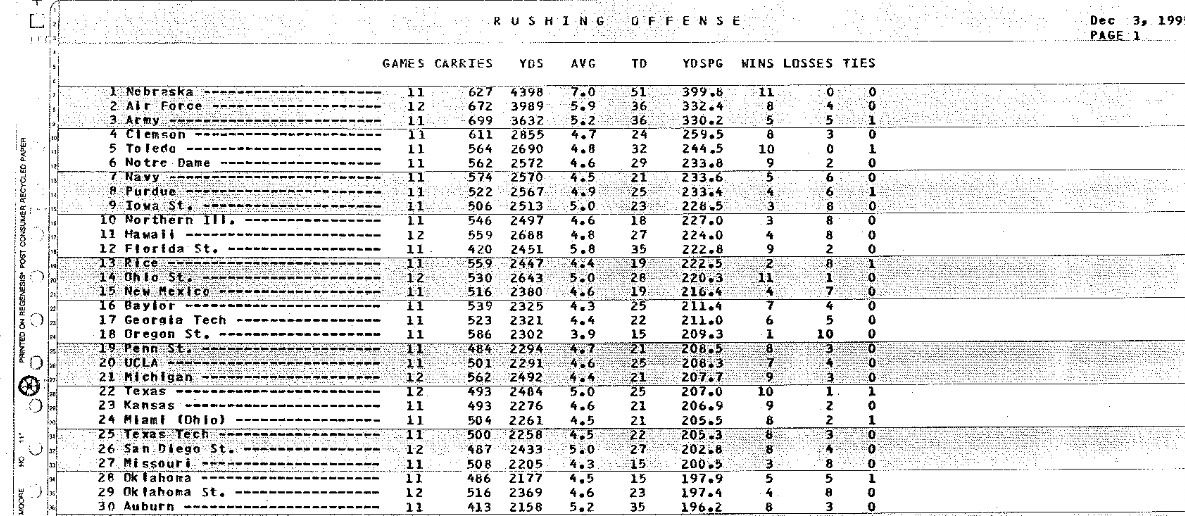
And just for fun, in the days before digital, a lot of records were kept by taking pictures of stats sheets, like this from 1995:
Rushing offense
2021: 114th (108.1 ypg)
2020: 55th (174.3)
2019: 36th (190.6)
2018: 29th (161.4)
2017: 59th (170.2)
2016: 66th (171.9)
2015: 105th (134.2)
2014: 117th (101.9) - Franklin first year; finished 111th in total offense
2013: 57th (174.0)
2012: 83rd (143.9)
2011: 46th (165.4)
2010: 74th (142.5)
2009: 41st (169.8)
2008: 17th (205.9)
2007: 29th (193.8)
2006: 43rd (150.0)
2005: 14th (212.8)
2004: 81st (129.9)
2003: 90th (122.0)
2002: 10th (228.6)
2001: 88th (119.7)
2000: 62nd (142.2)
1999: 23rd (186.0)
1998: 30th (187.9)
1997: 16th (208.6)
1996: national rushing offense rankings not available; Lions averaged 203.3 ypg
1995: 19th (208.5)
1994: 6th (250.9)
1993: 14th (236.1)
1992: 21st (214.5)
1991: 25th (204.7)
1990: 38th (181.7)
1989: 25th (213.9)
No national rankings exist prior to 1989. These figures are Penn State's rushing yards per game.
1988: 165.1
1987: 216.5
1986: 240.6
1985: 187.2
1984: 192.8
1983: 186.8
1982: 207.5
1981: 245.4
1980: 241.9
1979: 224.5
1978: 201.6
1977: 214.5
1976: 195.5
1975: 212.2
1974: 251.5
1973: 272.2
1972: 202.7
1971: 323.9
1970: 276.9
1969: 241.2
1968: 273.9
1967: 173.8
1966: 180.7
1965: 224.7
1964: 197.5
1963: 168.9
1962: 210.2
1961: 230.0
1960: 222.2
1959: 208.4
1958: 244.5
1957: 185.9
1956: 241.4
1955: 188.9
1954: 268.3
1953: 184.6
1952: 131.0
1951: 206.6
1950: 167.8